The Matlab Graphs: Module 13 Assignment


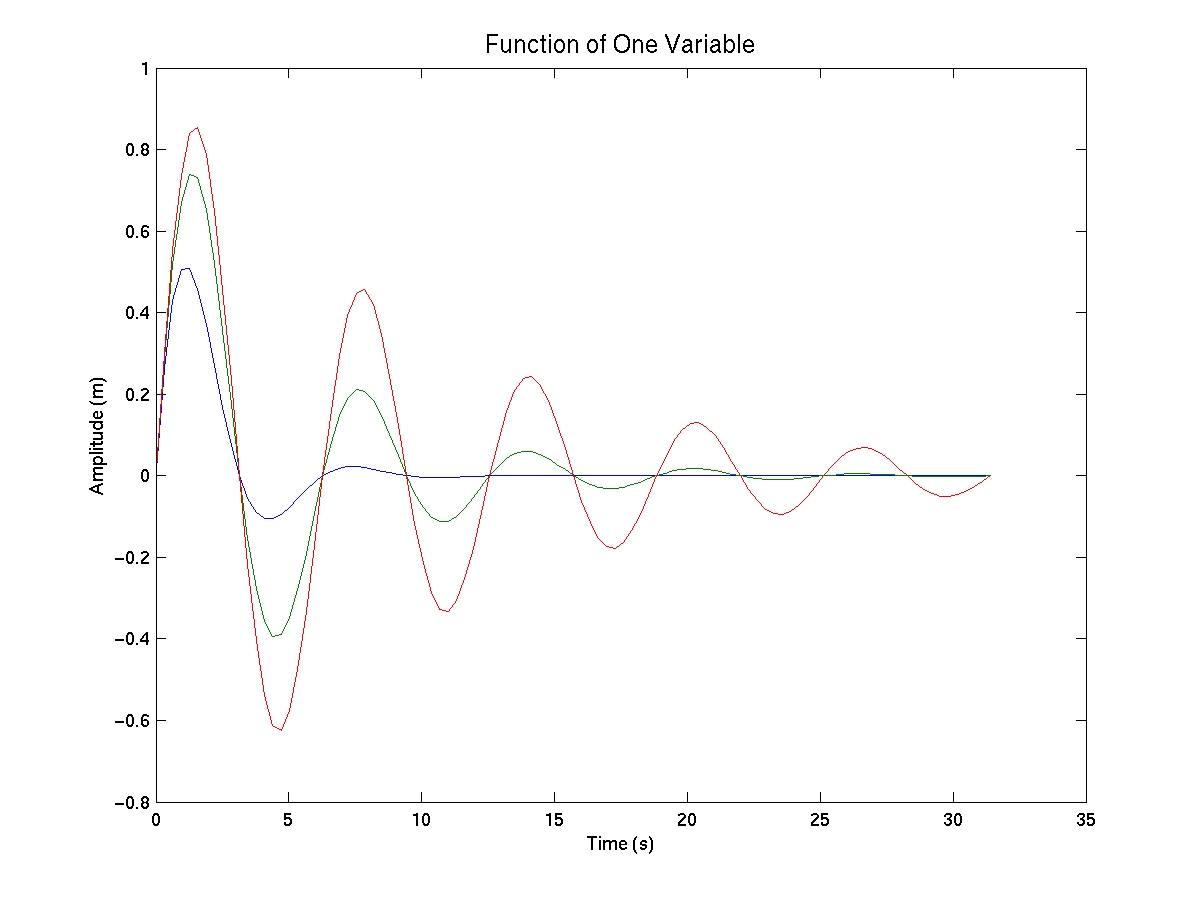
The Spectacular one-variable MATLAB graph

y= exp(-ax)sin(x)


My one variable graph.  Isn't it
beautiful?

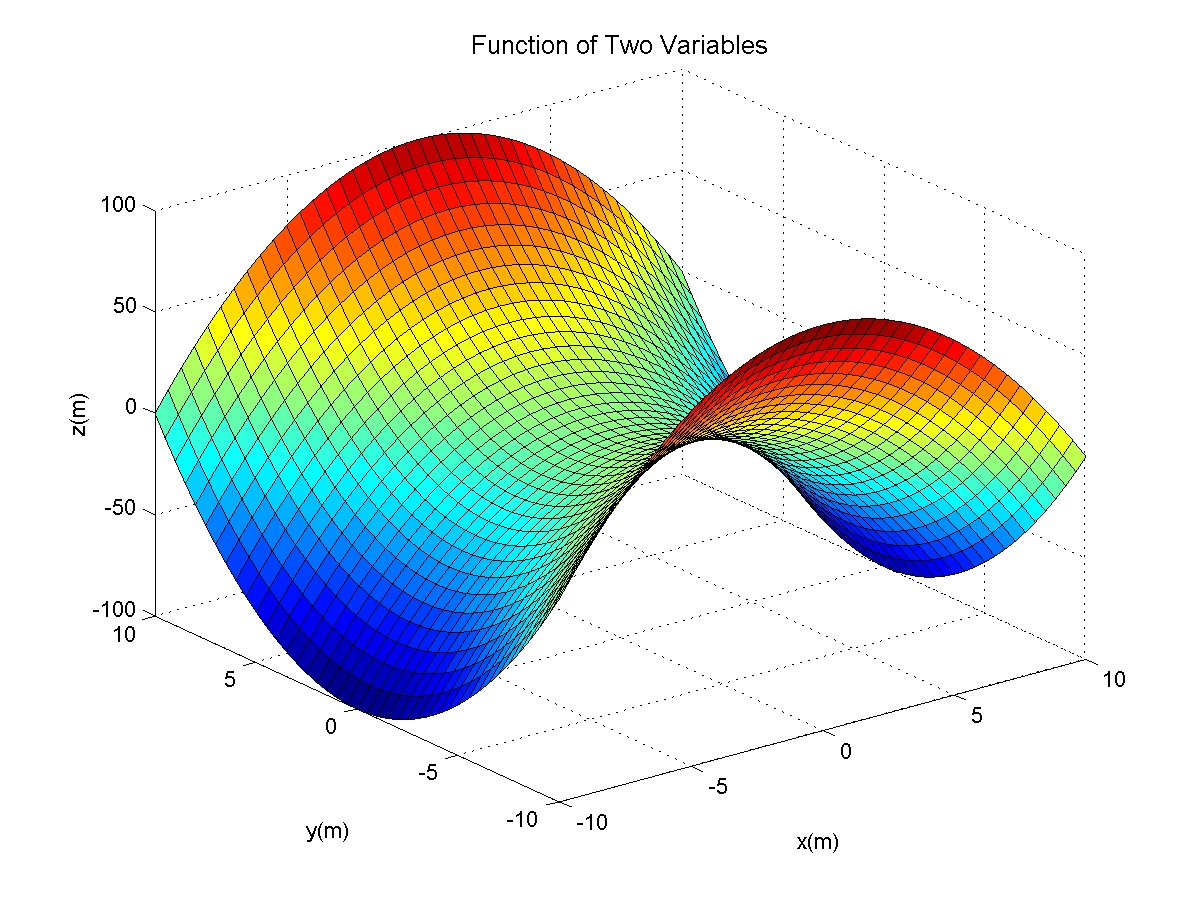
The Stupendous two variable MATLAB surface

z=y^2 -x^2 (hyperbolic paraboloid)


My two variable graph.  It's the best
ever.

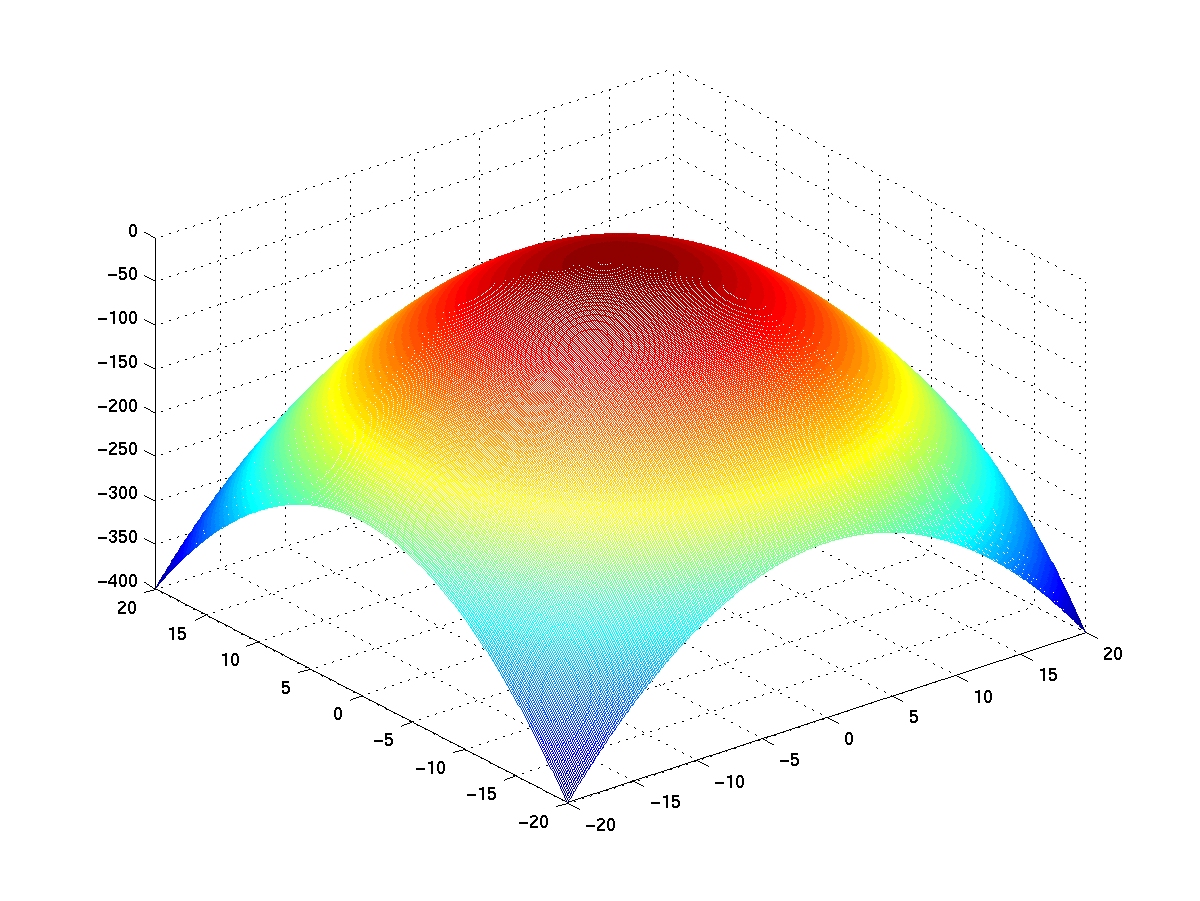
The Greatest Elliptic Paraboloid Ever (That's right, EVER)

x^2 + y^2 + 2z = 0


My Elliptic Paraboloid.  I have a
lot of free time, don't I?

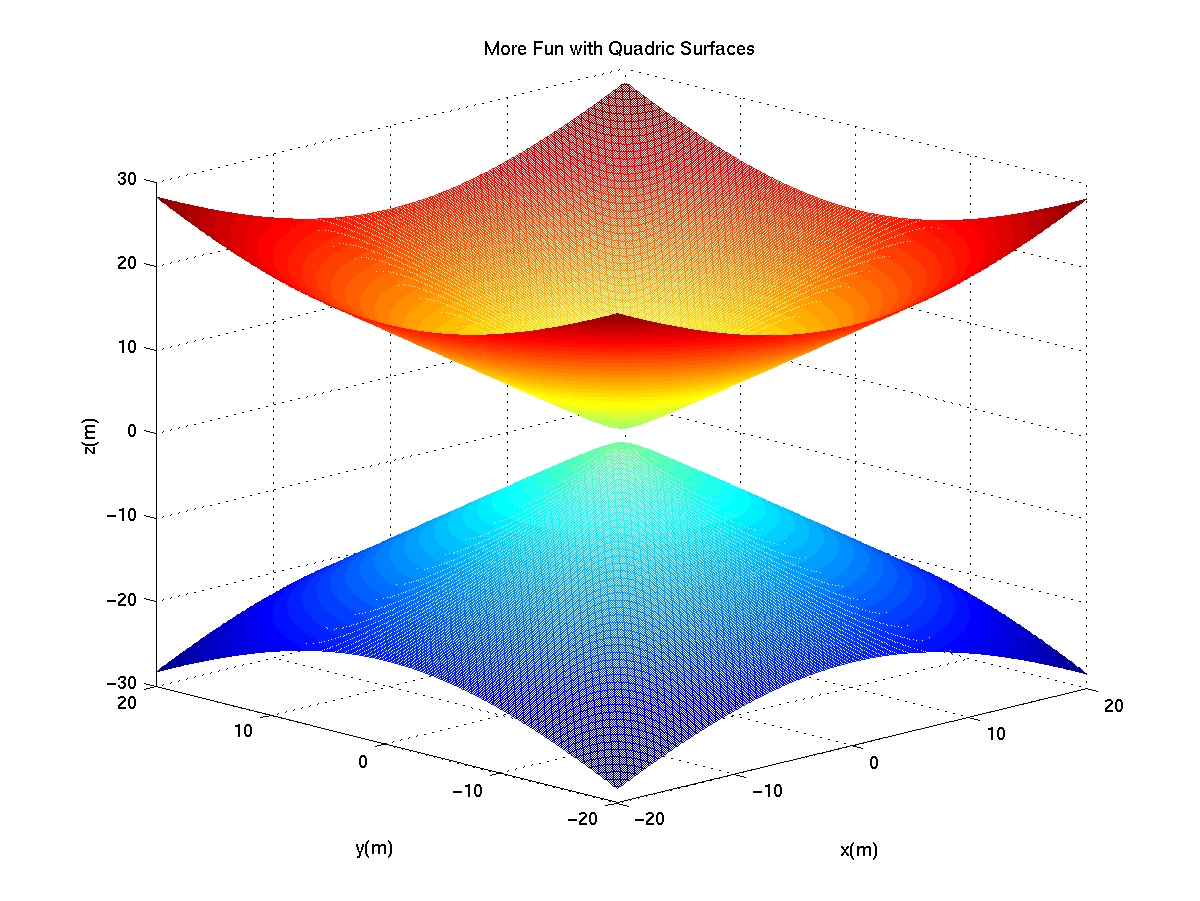
A hyperboloid of two sheets. Don't see many of these babies on campus.

x^2 + y^2 -z^2 = -1

My two sheet hyperboloid.  I've
been working on these while sitting in on Dr. Brubaker's summer program
for female researchers.  Need I mention the cute Comp Sci major seated
next to me?  I thought not

A Parabolic Cone. Isn't it lovely?


My Parabolic Cone.  I lost the equation
somewhere and can't find it.

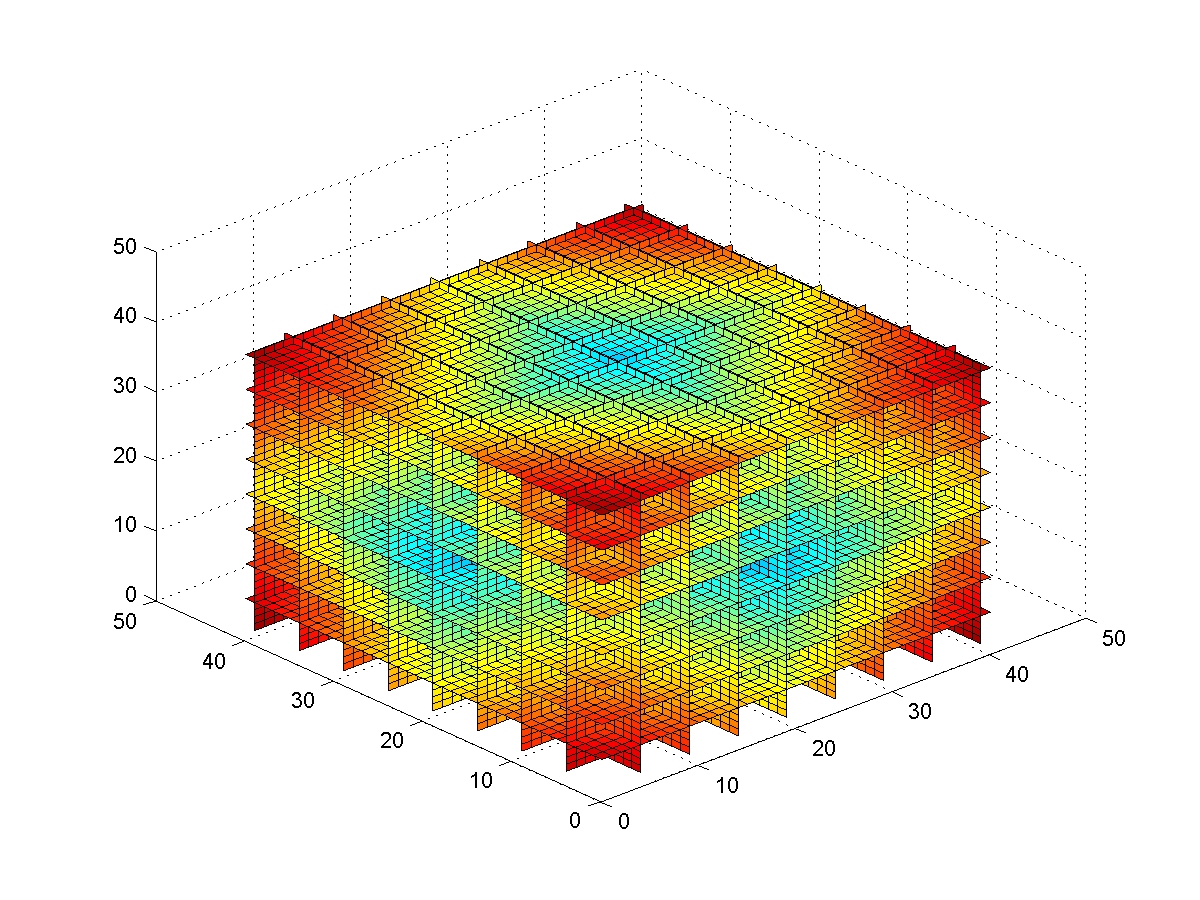
The very graphical graph of a three variable function

f = absx + absy + absz


My three variable graph, from the
default view.  More views will follow.


Return to main page
University
of Maryland, College Park

Copyright 2011 Andrew Parker
Last Modified 02 September 2011